2025-12 – MBS quarterly statistics - Year to date dashboard
2025-09 – MBS Quarterly Statistics – Year to Date Dashboard
2025-06 – MBS Quarterly Statistics – Year to Date Dashboard
2025-03 – MBS Quarterly Statistics – Year to Date Dashboard
2024-12 – MBS Quarterly Statistics – Year to Date Dashboard
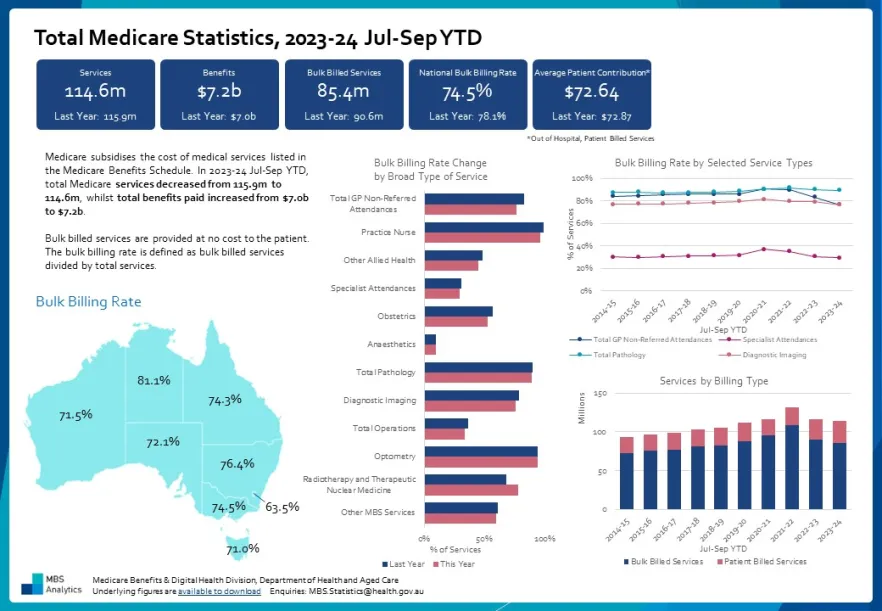
2024-09 – MBS Quarterly Statistics – Year to Date Dashboard
2024-06 – MBS Quarterly Statistics – Year to Date Dashboard
2024-03 – MBS Quarterly Statistics – Year to Date Dashboard
2023-12 – MBS Quarterly Statistics – Year to Date Dashboard
2023-09 – MBS Quarterly Statistics – Year to Date Dashboard
2023-06 – MBS Quarterly Statistics – Year to Date Dashboard
2023-03 – MBS Quarterly Statistics – Year to Date Dashboard
2022-12 – MBS Quarterly Statistics – Year to Date Dashboard
About this resource
Publication date:
Publication type:
Infographic
Audience:
General public
Language:
English
Part of a collection: