Filter results
You can narrow down the results using the filters
Audience
Publication type
Topics
Our work
Diseases
9586 results
-

MyMedicare Program Guidelines
The MyMedicare Program Guidelines (the guidelines) provide clear guidance for practices, General Practitioners (GPs) and patients who wish to voluntarily register with the MyMedicare Program (the program). The guidelines also set out the program’s requirements, benefits and dispute processes. -

Maternal RSV case study Amira – social media tile
Social media tile about Amira and her experience with RSV and maternal vaccinations. -

Maternal RSV case study Mei-Ling – social media tile
Social media tile about Mei-Ling and her experience with RSV and maternal vaccinations. -

Workforce Incentive Program – Practice Stream (WIP-PS) fact sheet
This fact sheet provides information on the Workforce Incentive Program Practice Stream (WIP-PS) payment. -

Residents’ Experience Survey – participant privacy notice
This privacy notice explains who collects information and what happens to it as part of the Residents' Experience Survey. -

COVID-19 vaccination – Local Government Area (LGA) – 1 July 2026
These reports list the percentage of people who have been vaccinated against COVID-19 by local government areas (LGA). -

COVID-19 vaccine rollout update – 01 July 2026
This presentation, delivered on 01 July 2026, contains an update to Australia's COVID-19 vaccine rollout. -

COVID-19 vaccination – vaccination data – 01 July 2026
These data files contain statistical data about Australia's COVID-19 vaccinations. -

How to review your submission and contact details using the Online Compliance Platform (OCP)
An online guide with instructions and pictures for providers using the OCP, explaining how to review their submission and update contact details. -

Designated Registered Nurse Prescriber - Clinical Mentorship Agreement template
After endorsement, a designated registered nurse prescriber must complete a six-month period of clinical mentorship with an authorised health practitioner to build confidence and competence in prescribing. -

Designated Registered Nurse Prescriber - Prescribing Agreement template
Designated registered nurse prescribers must have an active prescribing agreement in place with an authorised health practitioner. A national prescribing template is available and can be adapted to local clinical and governance requirements. -

Designated Registered Nurse Precriber - Prescribing Agreement template
After endorsement, a designated registered nurse prescriber must complete a six-month period of clinical mentorship with an authorised health practitioner to build confidence and competence in prescribing. -

Changes to personal care information sessions for Support at Home providers – Presentation – 25 June 2026
View the presentation slides from the changes to personal care information session for Support at Home providers held on 25 June 2026. -

Changes to personal care information sessions for Support at Home providers – Presentation – 9 July 2026
View the presentation slides from the changes to personal care information session for Support at Home providers held on 9 July 2026. -

Technical Advisory Group for NDIS functional capacity – Communique – July 2026
The first meeting of the Technical Advisory Group for NDIS functional capacity was held on 9 July 2026. Read the communique, which summarises the meeting discussions and outcomes. -

Registered nurse coverage in residential aged care dashboard
This dashboard provides users with high level information on 24/7 registered nurse coverage in residential aged care. -
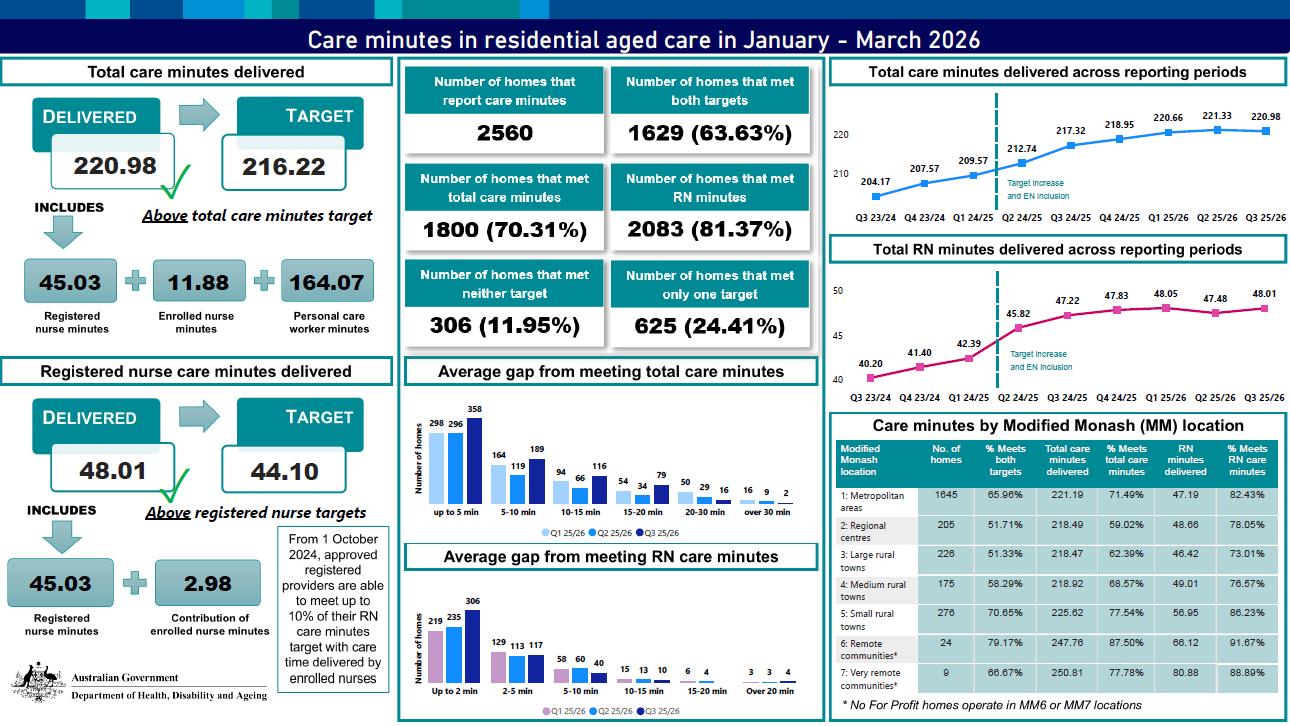
Care minutes in residential aged care dashboard
This dashboard provides users with high level information on care minutes in residential aged care. -

MBS Review Advisory Committee communique – June 2026
This communique is published following each meeting of the MBS Review Advisory Committee (MRAC). It summarises the meeting outcomes, progress on current reviews and advice about upcoming reviews. -

Privacy and your personal information: Public Health (Tobacco and Other Products) Act 2023
The Department of Health, Disability and Ageing (the department) administers the reporting and disclosure requirements in the Public Health (Tobacco and Other Products) Act 2023. -

Reporting under the Public Health (Tobacco and Other Products) Act 2023: Tobacco product ingredients report
If you need to submit a report, you must submit in the form of this template. Details on how to complete the templates can be found in the introduction tab of each template. -

Reporting under the Public Health (Tobacco and Other Products) Act 2023: Tobacco product volumes report
If you need to submit a report, you must submit in the form of this template. Details on how to complete the templates can be found in the introduction tab of each template. -

Reporting under the Public Health (Tobacco and Other Products) Act 2023: Tobacco product marketing and promotional expenditure report
If you need to submit a report, you must submit in the form of this template. Details on how to complete the templates can be found in the introduction tab of each template. -

Health Peak and Advisory Bodies Program round 4 grant opportunity (GO7902) feedback for applicants
This fact sheet provides general feedback for applicants to Round 4 of the Health Peak and Advisory Bodies Program grant opportunity. It highlights key observations from the grant application assessment process. -

DSOA Program manual – Appendix F – Change of Service Coordinator form
Disability Support for Older Australians (DSOA) Service Coordinators must use this form when applying for a change to a clients DSOA Service Coordinator. -

DSOA Program manual – Appendix G – Change request: client exit form
Disability Support for Older Australians (DSOA) Service Coordinators must use this form to report a client exit from the DSOA Program.