Filter results
You can narrow down the results using the filters
Audience
Topics
Our work
Diseases
405 results
-

Nepean Blue Mountains (NSW) Primary Health Network (PHN) map – socioeconomic disadvantage
This map shows the most socioeconomically disadvantaged areas within the Nepean Blue Mountains (NSW) Primary Health Network. -

Northern Sydney (NSW) Primary Health Network (PHN) map – socioeconomic disadvantage
This map shows the most socioeconomically disadvantaged areas within the Northern Sydney (NSW) Primary Health Network. -

North Coast (NSW) Primary Health Network (PHN) map – socioeconomic disadvantage
This map shows the most socioeconomically disadvantaged areas within the North Coast (NSW) Primary Health Network. -

South Eastern New South Wales Primary Health Network (PHN) map – socioeconomic disadvantage
This map shows the most socioeconomically disadvantaged areas within the South Eastern New South Wales Primary Health Network. -

South Western Sydney (NSW) Primary Health Network (PHN) map – socioeconomic disadvantage
This map shows the most socioeconomically disadvantaged areas within the South Western Sydney (NSW) Primary Health Network. -

Western New South Wales Primary Health Network (PHN) map – socioeconomic disadvantage
This map shows the most socioeconomically disadvantaged areas within the Western New South Wales Primary Health Network. -

Western Sydney (NSW) Primary Health Network (PHN) map – socioeconomic disadvantage
This map shows the most socioeconomically disadvantaged areas within the Western Sydney (NSW) Primary Health Network. -
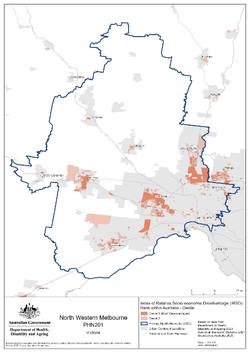
North Western Melbourne (Vic) Primary Health Network (PHN) map – socioeconomic disadvantage
This map shows the most socioeconomically disadvantaged areas within the North Western Melbourne (Vic) Primary Health Network. -

South Eastern Melbourne (Vic) Primary Health Network (PHN) map – socioeconomic disadvantage
This map shows the most socioeconomically disadvantaged areas within the South Eastern Melbourne (Vic) Primary Health Network. -

Central Queensland, Wide Bay, Sunshine Coast Primary Health Network (PHN) map – socioeconomic disadvantage
This map shows the most socioeconomically disadvantaged areas within the Central Queensland, Wide Bay, Sunshine Coast Primary Health Network. -

Darling Downs and West Moreton (Qld) Primary Health Network (PHN) map – socioeconomic disadvantage
This map shows the most socioeconomically disadvantaged areas within the Darling Downs and West Moreton (Qld) Primary Health Network. -

Hunter, New England and Central Coast (NSW) Primary Health Network (PHN) map – socioeconomic disadvantage
This map shows the most socioeconomically disadvantaged areas within the Hunter, New England and Central Coast (NSW) Primary Health Network. -

Central and Eastern Sydney (NSW) Primary Health Network (PHN) map – socioeconomic disadvantage
This map shows the most socioeconomically disadvantaged areas within the Central and Eastern Sydney (NSW) Primary Health Network. -

COVID-19 response update for primary care – 8 June 2023
This webinar on 8 June is part of a series to update primary care on the COVID-19 response and the vaccine rollout. The panel will provide key updates and answer participants’ questions. -

COVID-19 vaccination – vaccination data – 11 April 2025
This data file contains statistical data about Australia's COVID-19 vaccinations. -
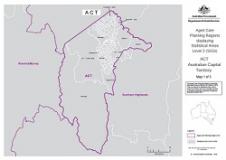
2015 ACT Aged Care Planning Region
View the Aged Care Planning Region 2015 determination for the Australian Capital Territory and the maps showing Statistical Areas Level 2 (SA2s) in the planning region. -
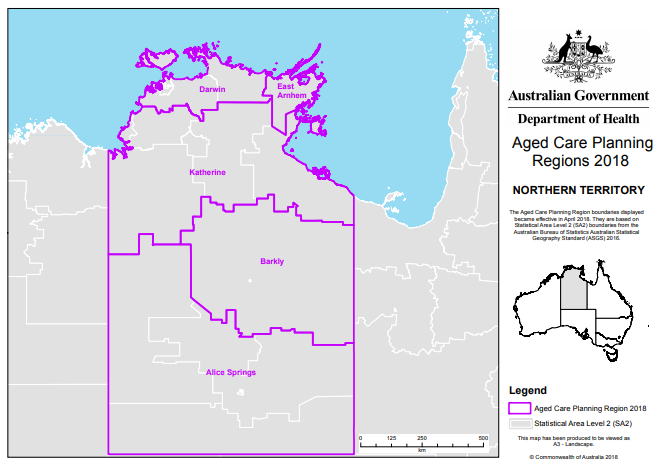
2018 NT Aged Care Planning Regions
The current Northern Territory Aged Care Planning Regions became effective in April 2018. Aged Care Planning Regions are based on Statistical Area Level 2 (SA2) boundaries. -
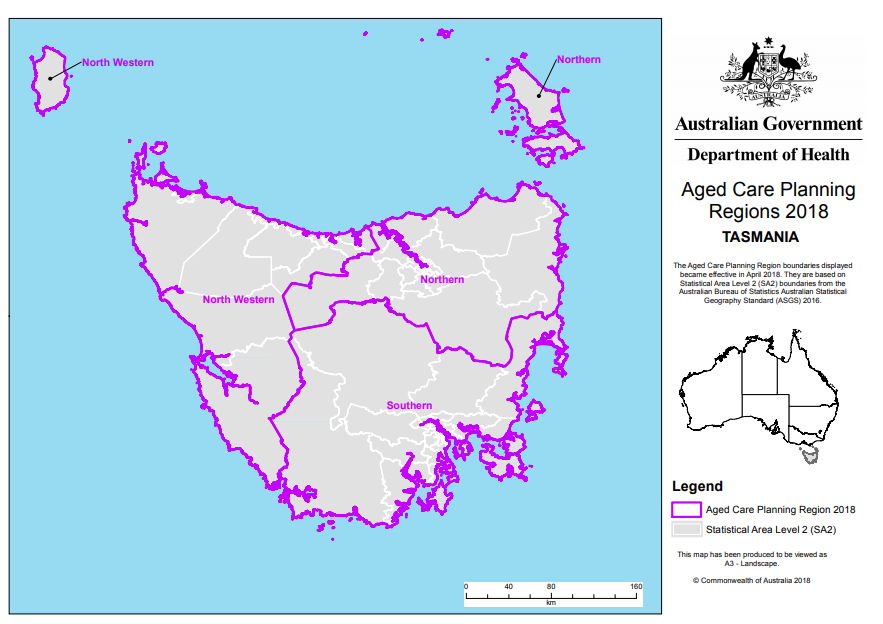
2018 Tas Aged Care Planning Regions
The current Tasmania Aged Care Planning Regions became effective in April 2018. Aged Care Planning Regions are based on Statistical Area Level 2 (SA2) boundaries. -
 1:02
1:02Casey Shorter, a practice manager case study
Watch this video of practice manager Casey Shorter, as she shares her joys of living and working in a regional community. -

Primary Health Networks (PHN) (2017) – concordance files – Postal Areas (2021)
Researchers can use these concordance files for Postal Areas to Primary Health Networks to undertake geospatial and data analysis. -
Primary Health Networks (PHN) (2017) – concordance files – Commonwealth Electoral Divisions (2021)
Researchers can use these concordance files for Commonwealth Electoral Divisions 2021 to Primary Health Networks 2017 to undertake geospatial and data analysis. -
Primary Health Networks (PHN) (2017) – concordance files – Commonwealth Electoral Divisions (2021)
Researchers can use these concordance files for Commonwealth Electoral Divisions (2021) to Primary Health Networks 2017 to undertake geospatial and data analysis. -
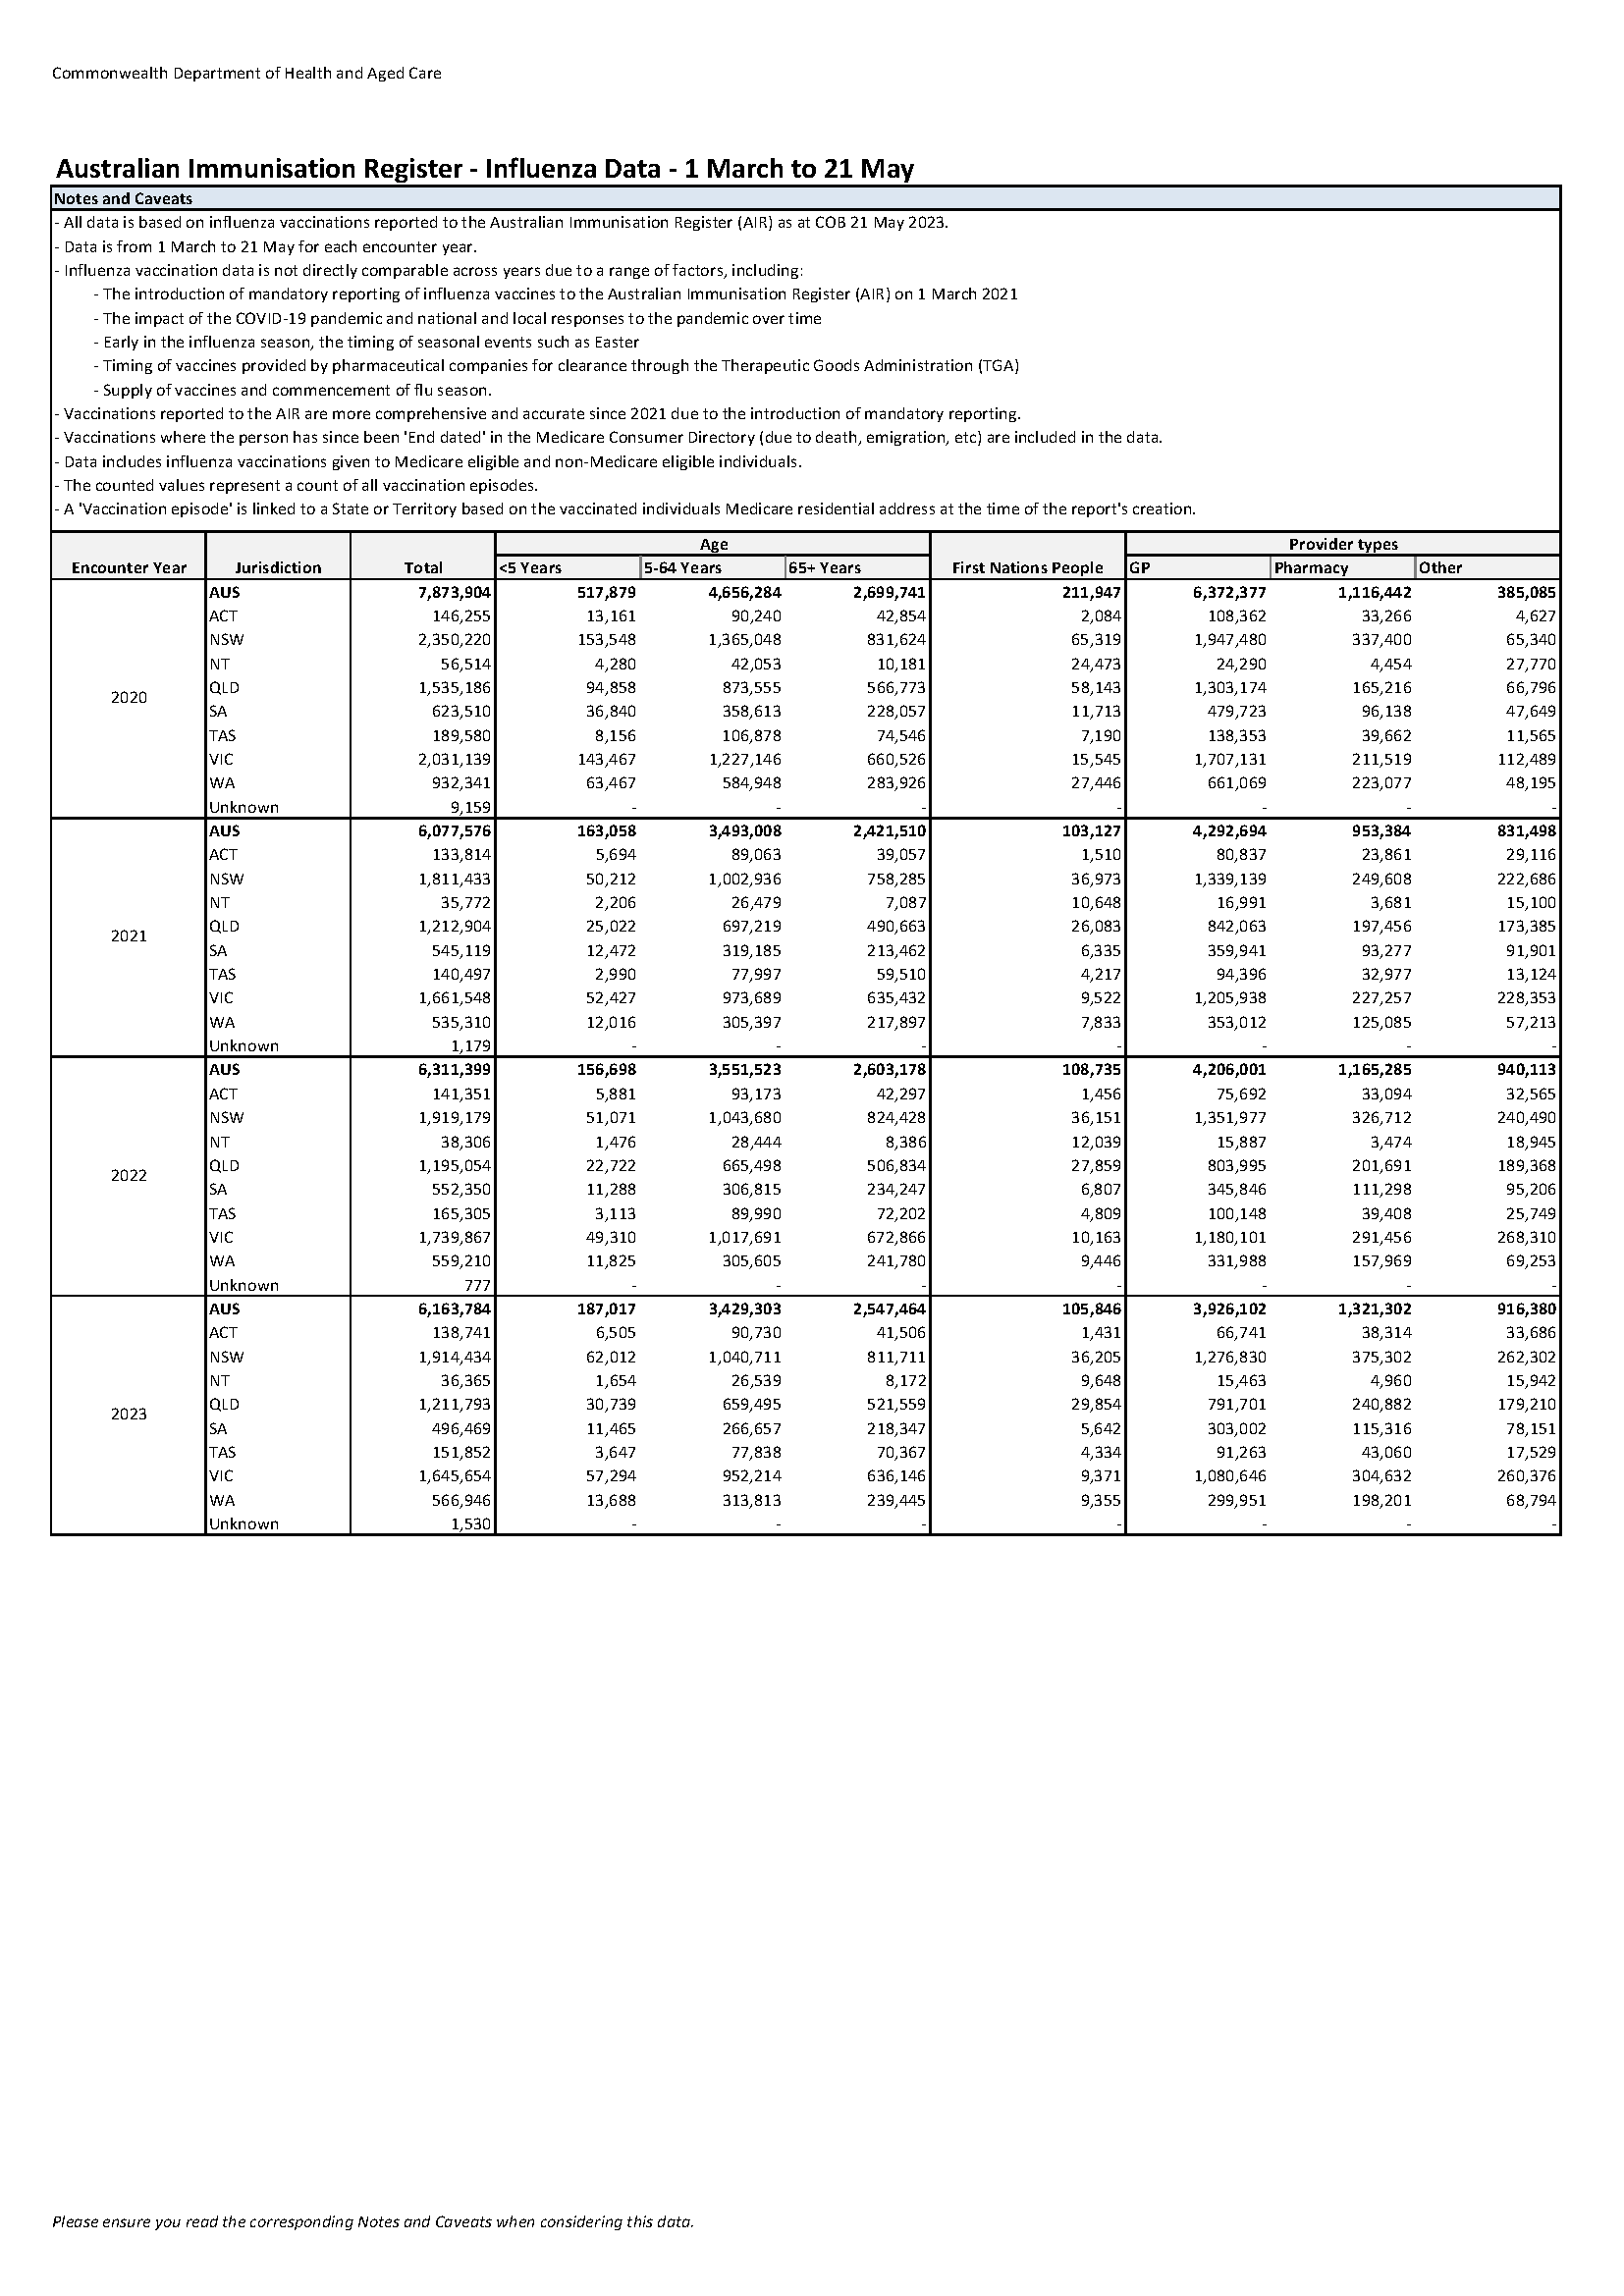
Influenza (flu) immunisation data – 1 March to 21 May – 2020–2023
This infographic shows the number of flu (influenza) vaccinations reported to the Australian Immunisation Register (AIR) during the 2020-2023, since 1 March. -
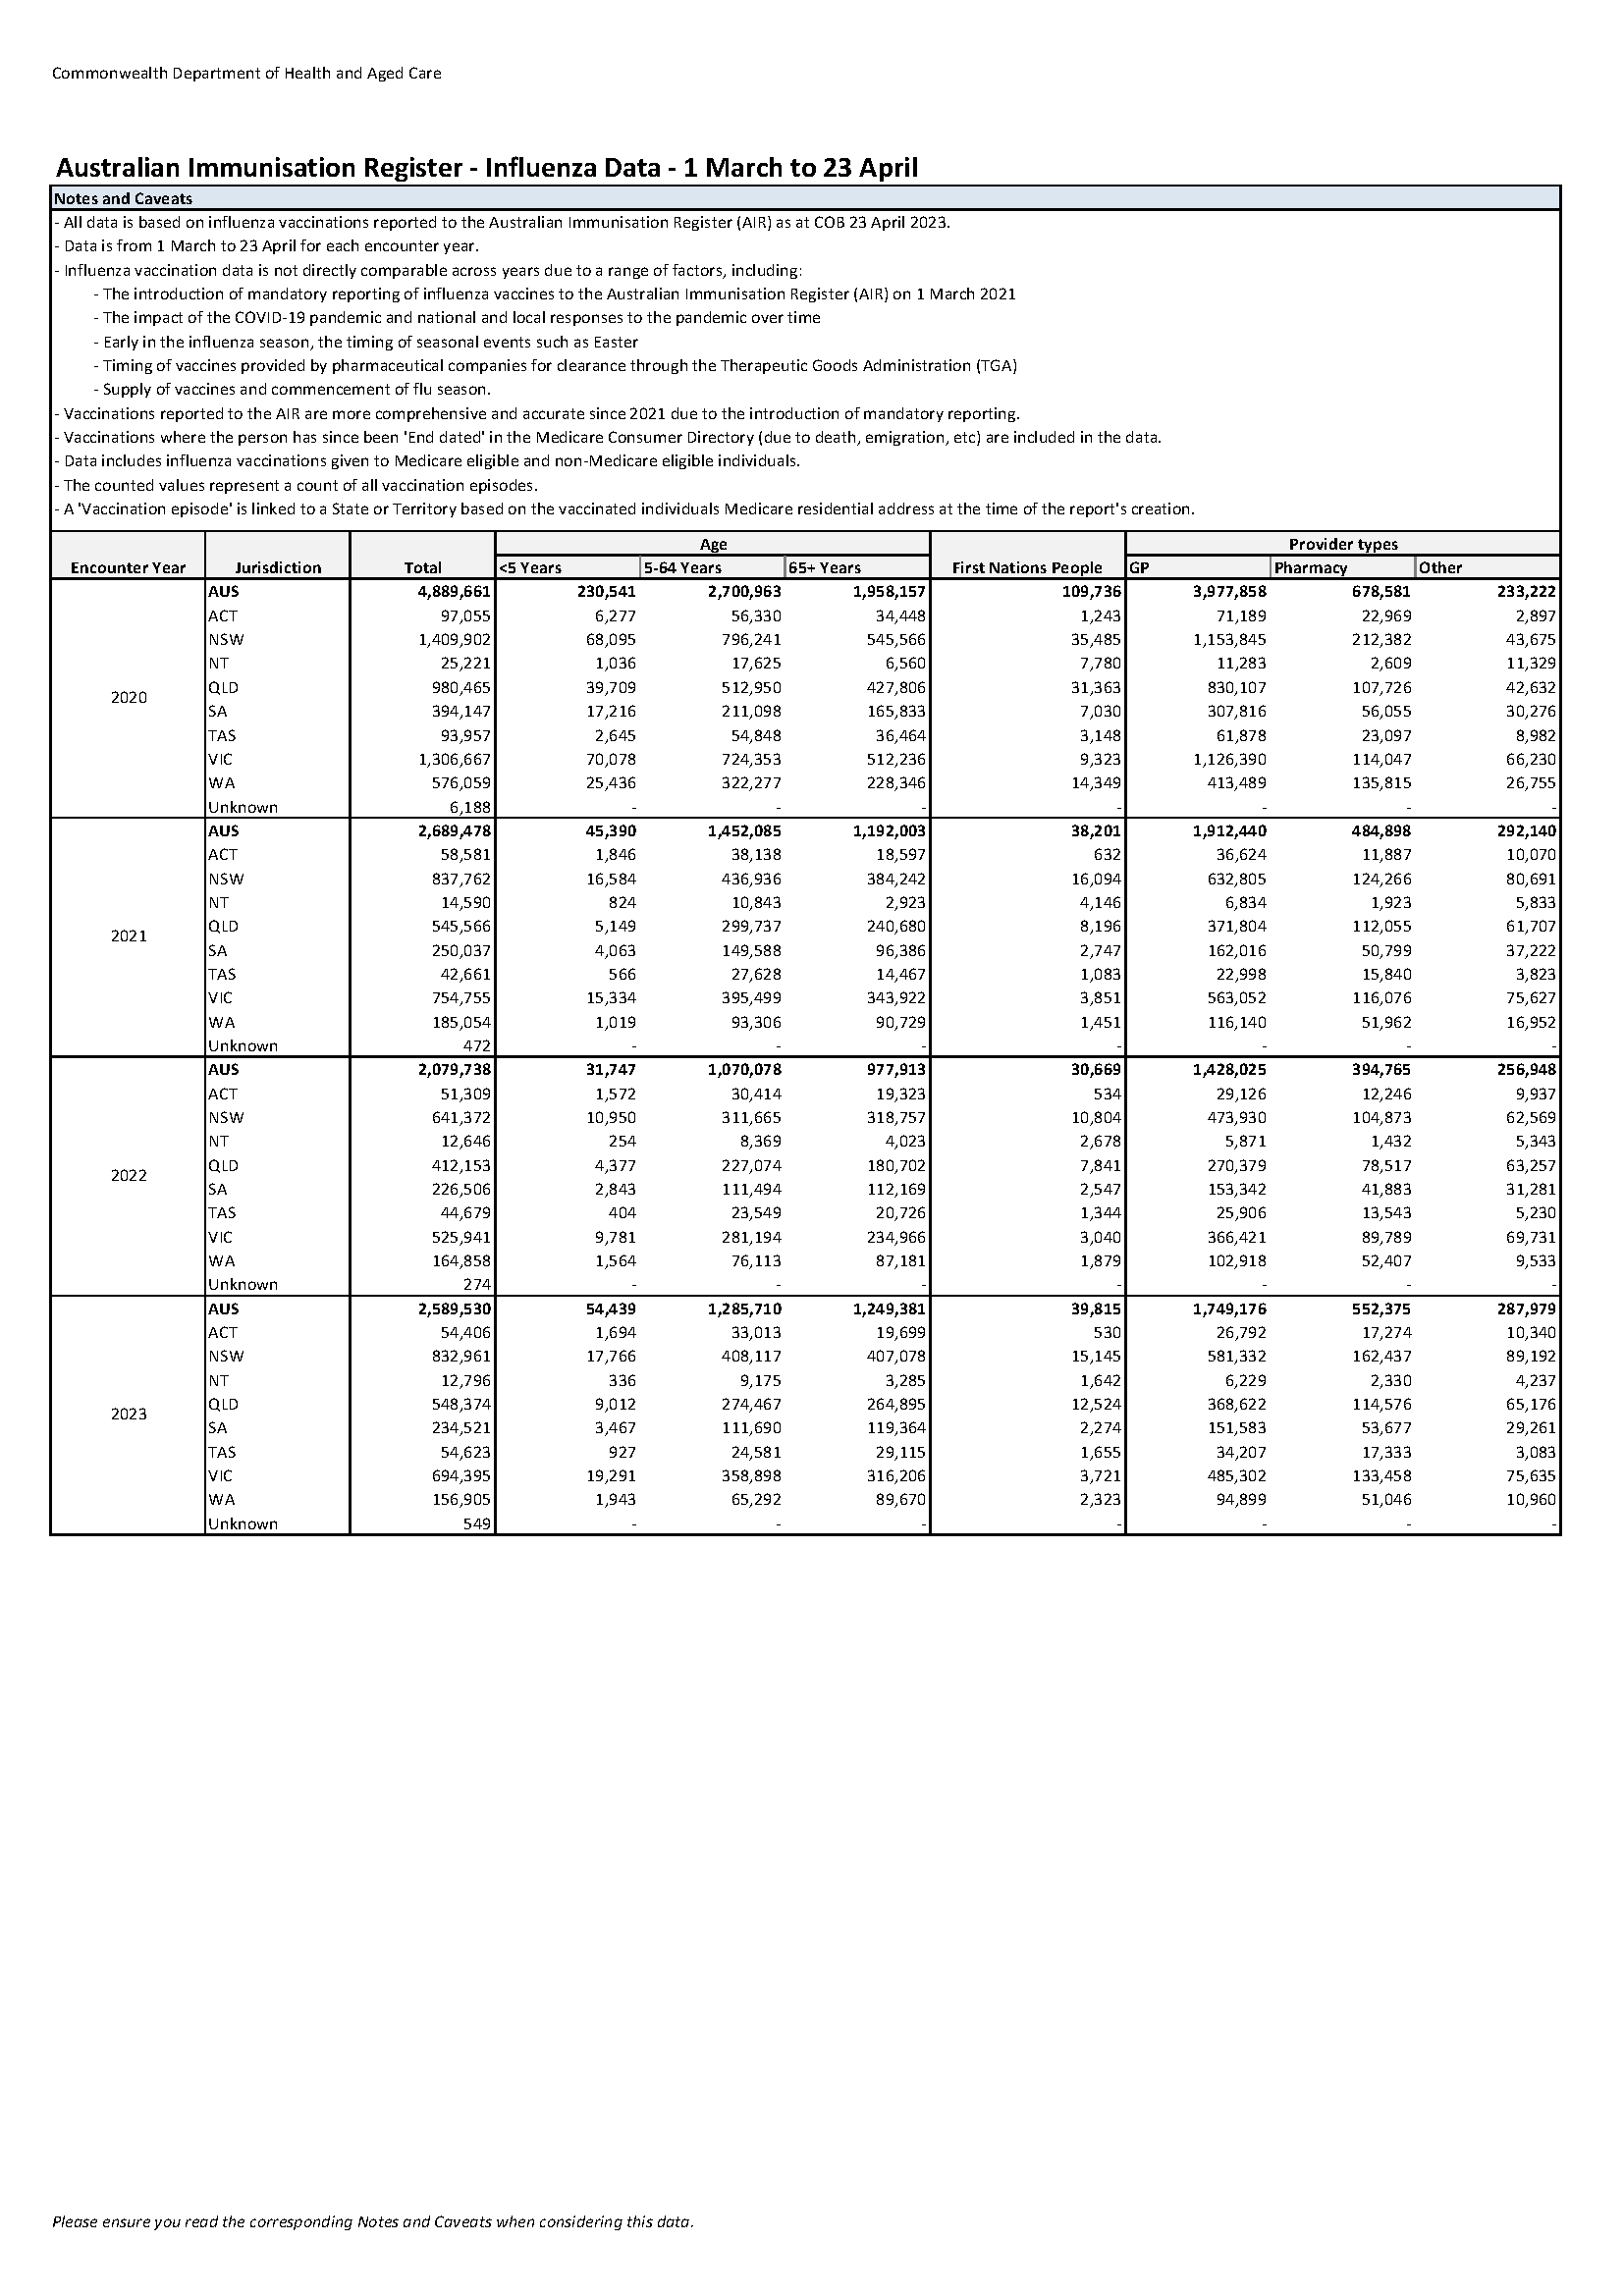
Influenza (flu) immunisation data – 1 March to 14 May – 2020–2023
This infographic shows the number of flu (influenza) vaccinations reported to the Australian Immunisation Register (AIR) during the 2020-2023, since 1 March. -
 50:51
50:51In conversation with Professor John Hirdes
Professor John Hirdes discusses integrated care and shares his perspectives on AI, data standards and digital transformation