About this resource
Publication date:
Publication type:
Infographic
Language:
English
Part of a collection:
Australian Government Department of Health, Disability and Ageing
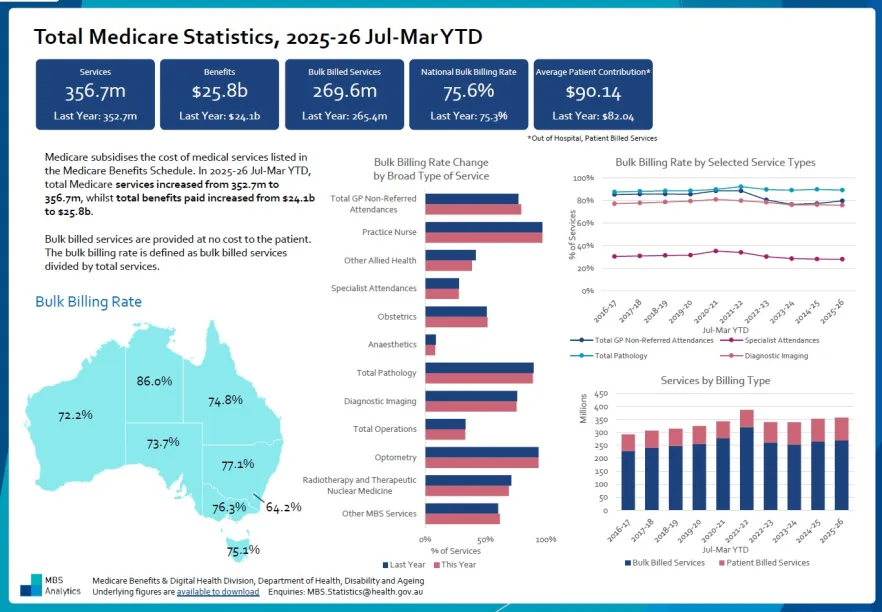
This infographic shows statistics about Medicare use, including the number of fully paid and bulk-billed services used, the amount of benefits paid and the types of health services people used from July to March 2025-26. Includes bulk billing by Primary Health Network.