Collection description
This collection contains infographics published regularly to present the situation of coronavirus (COVID-19) in Australia.
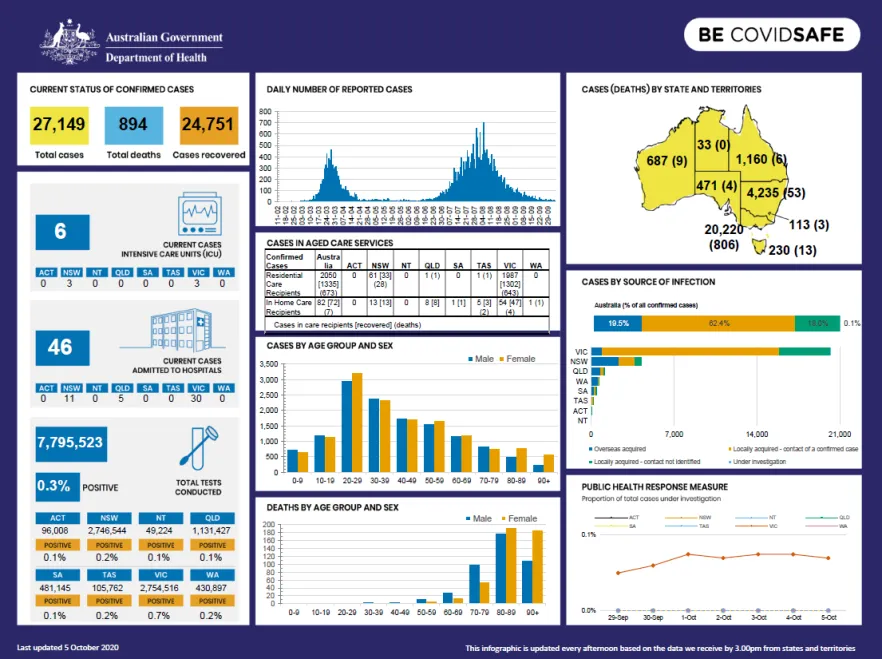
Each infographic shows:
- total number of cases, recoveries and deaths
- cases admitted to hospitals and ICUs
- number of tests done and their status
- a graph showing daily number of reported cases
- cases in aged care services
- a graph showing cases by age and gender
- a graph showing deaths by age and gender
- cases and deaths by state and territory
- cases by source of infection
- public health response measures.
Daily COVID-19 data reports have moved to a national interactive COVID-19 weekly trends report.
The COVID-19 weekly trends report provides key data and analysis for the previous week.
September 2022
August 2022
July 2022
June 2022
May 2022
April 2022
March 2022
February 2022
January 2022
December 2021
November 2021
May 2020
October 2021
September 2021
August 2021
July 2021
June 2021
May 2021
April 2021
March 2021
February 2021
January 2021
December 2020
November 2020
October 2020
September 2020
August 2020
July 2020
June 2020
April 2020
We aim to provide documents in an accessible format. If you're having problems using a document with your accessibility tools, please contact us for help.
Publication date:
Date last updated:
Publication type:
Collection
Audience:
General public